Explaining spaCy Models with Shap
Using explainability to understand a NLP algorithm trained with spaCy


Explainabili...what ?
One of the most important downsides to Deep Learning is the apparent loss of interpretability that it introduces. As a matter of facts, Deep Learning models are no longer deterministic nor simple enough to be interpreted through their internal states. Models now have trillions of parameters with little to no sense at all.
On of the recent trends to tackle this issue is to use explainability techniques, such as LIME and SHAP which can both be applied to any type of ML model. Both offer a large variety of tools to help understand the behavior of a model globally (what is learnt by the model) or locally (why the model took such or such decision for a given data). One popular and helpful way to explain a prediction from a model is to highlight which features contributed the most to the prediction. LIME and SHAP offer different ways to do so:
- LIME is an explainability technique that uses what we call a local surrogate model - i.e. a second model that locally approximates the model to explain - and infers explainability metrics from the second model. LIME is quite popular and very often used, even though the surrogate nature of the technique is often criticized (there is no guarantee that the surrogate model approximates well the actual model).
- SHAP is based on Shapeley Values, a game-theoretic concept that tests all possible combinations of features in order to determine the marginal contributions of each one. SHAP has more theoretical guarantees and good properties, hence it is often considered more reliable than LIME, even though it is more time consuming.
More details can be found on both techniques in this post or in this excellent book from Christopher Molnar.
In this article we'll show how to use SHAP on textual inputs, and more specifically for the popular open source NLP library spaCy.
Explaining Natural Language Processing models
The discipline of processing texts is called Natural Language Processing. It contains (but is not limited to) using machine learning models to analyse texts.
Unlike tabular data, where each feature can be represented by a number and can therefore be given directly to a model, text data need to be pre-processed before being provided to a ML model. This pre-processing text, called tokenization, basically consists of converting each word1 (token) into a number. For that the tokenizer requires a dictionary which will list all word to number matches. This dictionary is called a vocabulary.
For example if my whole corpus is the following list of documents: ["I am Yoann Couble", "I work for PALO-IT", "I work with NLP for companies"], the vocabulary would be :
{
    "I": 1,
    "am": 2,
    "Yoann": 3,
    "Couble": 4,
    "work": 5,
    "for": 6,
    "PALO-IT": 7,
    "with": 8,
    "NLP": 9,
    "companies": 10,
}
Therefore, tokenizing the last sentence would result in this vector : [1, 5, 8, 9, 6, 10].
The tokenizer is important to use explainability techniques, since these techniques often resort to twisting the inputs to observe the effects on the outputs. On text, varying the token integer representation would have no meaning at all. So instead, the explainer removes tokens from the input and observes the impact on the output of the model. With SHAP, the permutation explainer does exactly that and in a way that enables to approximate shapeley values of each feature.
As an example, permutation would mean passing "I ... with NLP for ...", "... work with ... for companies", etc. to the model and see by how much the result of the model changes.
Some tokenization algorithms are however even more fine grained than that and split words into sub-words, phonemes, syllables to allow for more robust or versatile language representation.↩
Explaining the results of a spaCy text classification model
Now let's see in practice how to use SHAP to get some insights on a model trained with spaCy (see this article on how to do so). In this article we're going to use text classification as an example, and a custom pipeline specialized for this. You can find the pipeline here (you'll need to unzip it) and the dataset there.
spaCy wrappers for SHAP
SHAP supports text data, but has little to no support for spaCy models natively, so we'll need to create some wrappers and assemble precisely the different parts required by SHAP.
The permutation explainer, which is the one preferred by SHAP for text data, requires several parameters:
- a prediction function, which takes a list of texts and returns a list of results (in the case of a text classifier, this means the classes and their corresponding probability)
- a tokenizer to build a Text masker for SHAP.
These features are present in spaCy nlp pipelines but not as functions. They are embedded in the pipeline and produce results inside the document object. Let's write some wrappers around the pipeline to conform to shap expectations.
%pip install -qqq shap "spacy>3.2.0" pandas
import spacy

textcat_spacy = spacy.load("model-best")
tokenizer_spacy = spacy.tokenizer.Tokenizer(textcat_spacy.vocab)

classes = list(textcat_spacy.get_pipe("textcat").labels)

# Define a function to predict
def predict(texts):
    # convert texts to bare strings
    texts = [str(text) for text in texts]
    results = []
    for doc in textcat_spacy.pipe(texts):
        # results.append([{'label': cat, 'score': doc.cats[cat]} for cat in doc.cats])
        results.append([doc.cats[cat] for cat in classes])
    return results


# Create a function to create a transformers-like tokenizer to match shap's expectations
def tok_wrapper(text, return_offsets_mapping=False):
    doc = tokenizer_spacy(text)
    out = {"input_ids": [tok.norm for tok in doc]}
    if return_offsets_mapping:
        out["offset_mapping"] = [(tok.idx, tok.idx + len(tok)) for tok in doc]
    return out
import shap

# Create the Shap Explainer
# - predict is the "model" function, adapted to a transformers-like model
# - masker is the masker used by shap, which relies on a transformers-like tokenizer
# - algorithm is set to permutation, which is the one used for transformers models
# - output_names are the classes (although it is not propagated to the permutation explainer currently, which is why plots do not have the labels)
# - max_evals is set to a high number to reduce the probability of cases where the explainer fails because there are too many tokens
explainer = shap.Explainer(
    predict,
    masker=shap.maskers.Text(tok_wrapper),
    algorithm="permutation",
    output_names=classes,
    max_evals=1500,
)
import pandas as pd

dataset = pd.read_csv("reddit_data.csv")["text"].tolist()
dataset[0]
shap_values = explainer(dataset[:1])
shap_values.output_names = classes
The shap values contain 3 attributes:
- the
valuesthemselves (one value per class per word) - the
base_value(which can be seen as a prior: what we would get for a empty string) - the
data: the words as they are tokenized
From this structure we can generate plots to help visualize the explanation.
fig_html = shap.plots.text(shap_values, display=False)
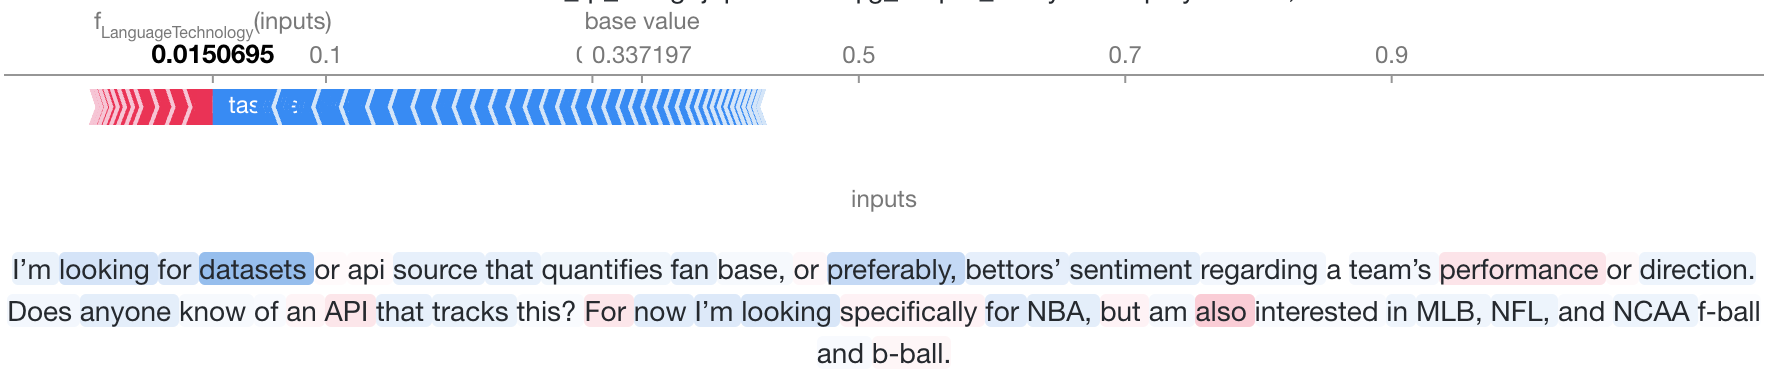
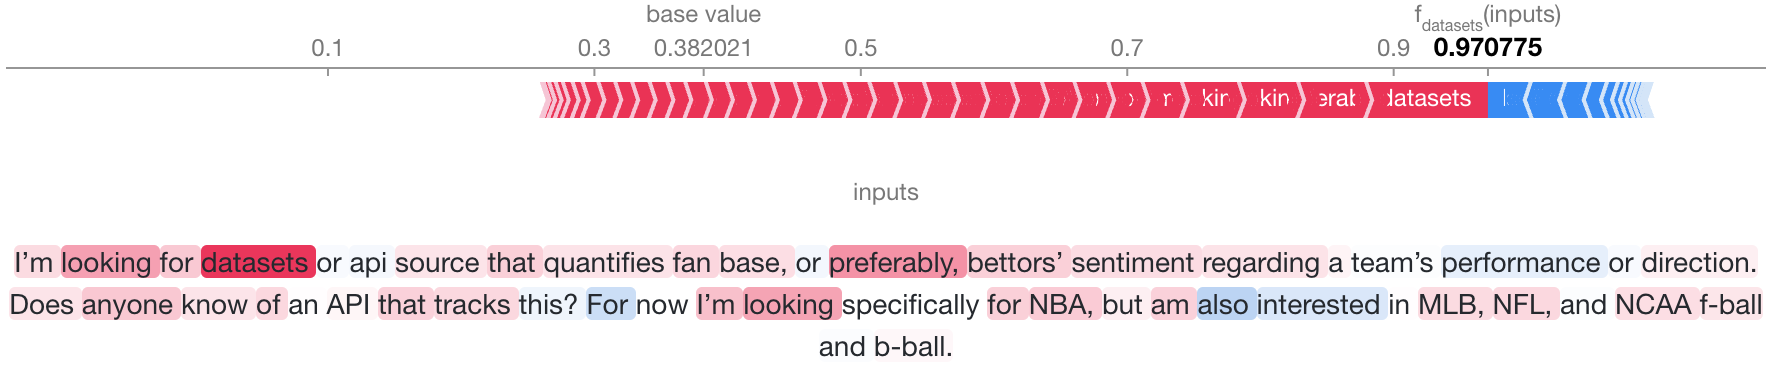
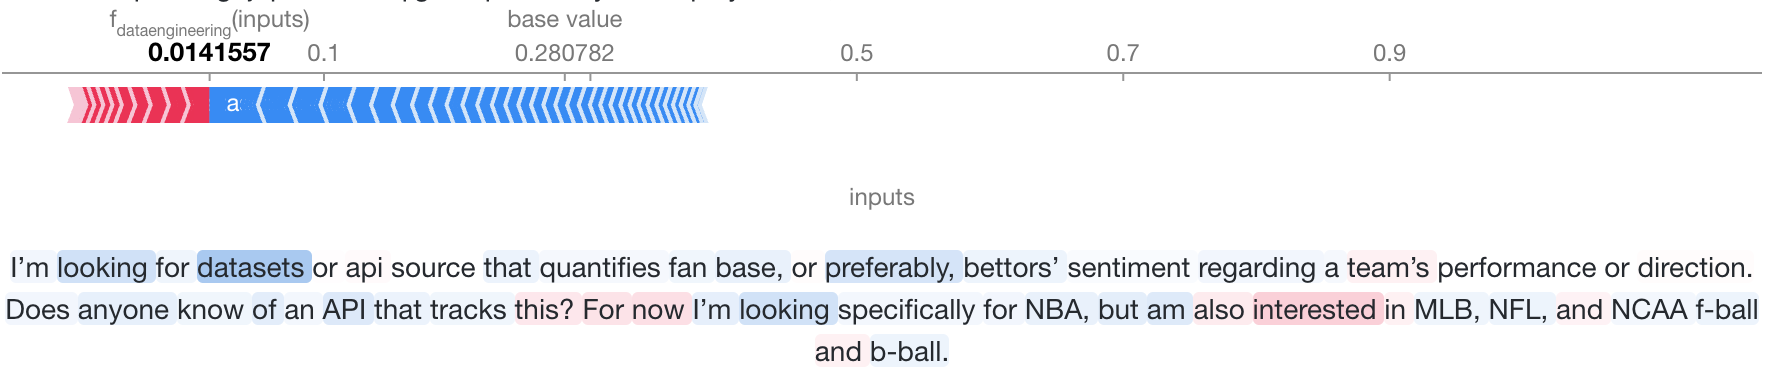
We can see the shap text plots provide us two elements than can be interactively changed to display the shap values for each output label:
- The first plot is a force plot, where the contribution of each word in favor (red) or against (blue) the selected label is displayed in a cumulative manner. The point where red and blue meet is the value predicted by the model for this label.
- The second plot is the text with each word highlighted depending on its contribution to the final decision.
That's it ! We've seen in this article how to adapt a spaCy pipeline to be able to use shap for our NLP explanations.